Train Graph Analysis
An interactive Python notebook to plot train graphs and analyse them for possible collisions!
What are train graphs?
I first learned about train graphs from this Numberphile video: Numberphile Video
When designing a railway timetable it can be tricky to know just by looking at a timetable its difficult to know if / when trains might pass each other (or worse collide). So timetable planners would plot their timetables on graphs (originally on paper now on complex software). These graphs would have the stations on the y-axis and the time on the x-axis. This visualisation gave them better insights onto their timetable, and, for example, instead of worrying about individual arrival times, they could just worry about adjusting the slopes of their lines to avoid intersections.
In this notebook I wanted to explore these train graphs digitally and find intersections automatically. I'll be storing my timetable in a pandas dataframe and using linear equations to plot intersections.
Example Timetable
I have written a tiny example timetable for use in this notebook. It involves three trains passing through three stations, all travelling at different speeds.
| Train | Station A | Station B | Station C |
|---|---|---|---|
| 1 | 09:00 | 09:25 | 09:55 |
| 2 | 09:10 | 09:20 | 09:30 |
| 3 | 09:20 | 09:50 |
We load this into a pandas dataframe with a couple of adjustments. I add a column which converts the time into minutes after 09:00 as the linear equations will be easier to manage with integers, and I also add a column which converts the station name to a Y coordinate (i.e. Station A -> 1, Station B -> 2 and so on), again to help us with linear equations later.
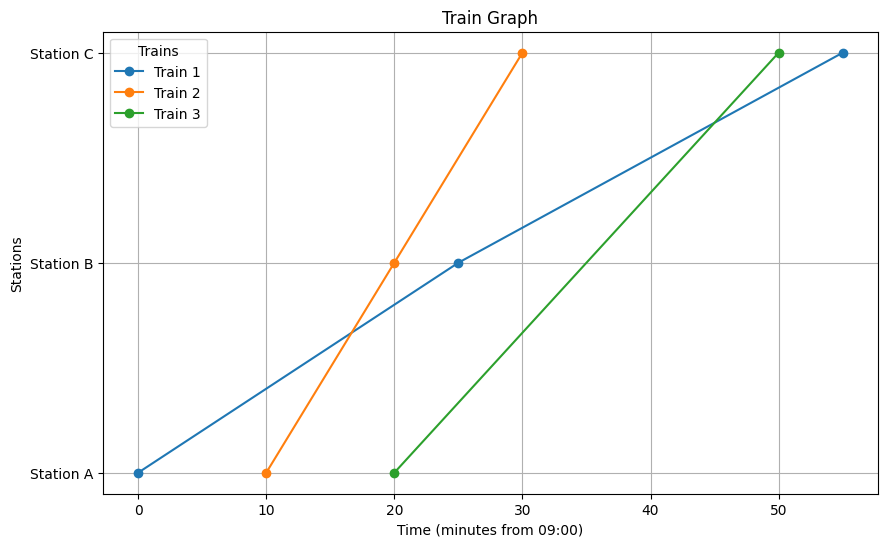
We can then plot this graph by plotting each train as its own line. Are there any intersections?
Linear Equations
From our GCSE maths we know we can describe a line on a graph using its gradient and its y-intercept. \[y = mx + c\] \[m = \frac{\delta y}{\delta x}\] \[c = y - mx\] We can then check where two lines intersect by solving their two linear equations simultaneously (assuming they are not parallel).
To start calculating these linear equations I split the train timetable up into segments in a new dataframe and store all the required linear information for each segement, and then check each segment against every other segment for intersections. While this does indeed find all the intersections, I'm currently looping over the dataframe manually several times with for loops and df.iterrows() which isn't the most pythonic / pandas way of going about the problem. In the future I would explore properly vectorising this process by using pandas' apply() and shift() methods.
I also use a frozenset() to store every discovered intersection as a way of making sure I'm only storing unique intersections (as every intersection will be found twice, A intersects with B and B intersects with A). This feels like a convoluted way to solve this problem and it perhaps would be better to avoid finding duplicates in the first place rather than remove them after being found.
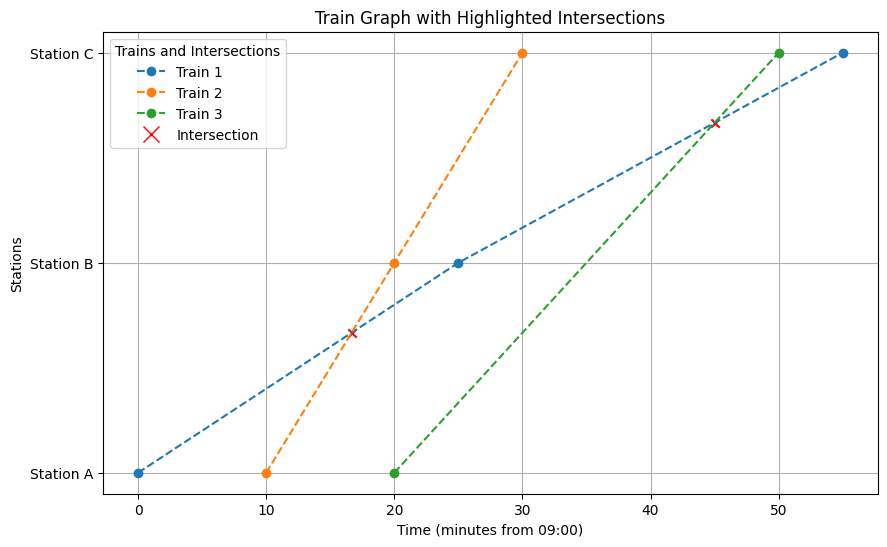
Plotting Intersections and Conclusions
Now we have found our intersections we can plot them to visualise where they are happening.

A train scheduler might use this knowledge to adjust the speed of the trains to avoid a collision, or add in a parallel piece of track to allow trains to overtake each other.
Technologies Used
- Python
- Matplotlib
- Pandas